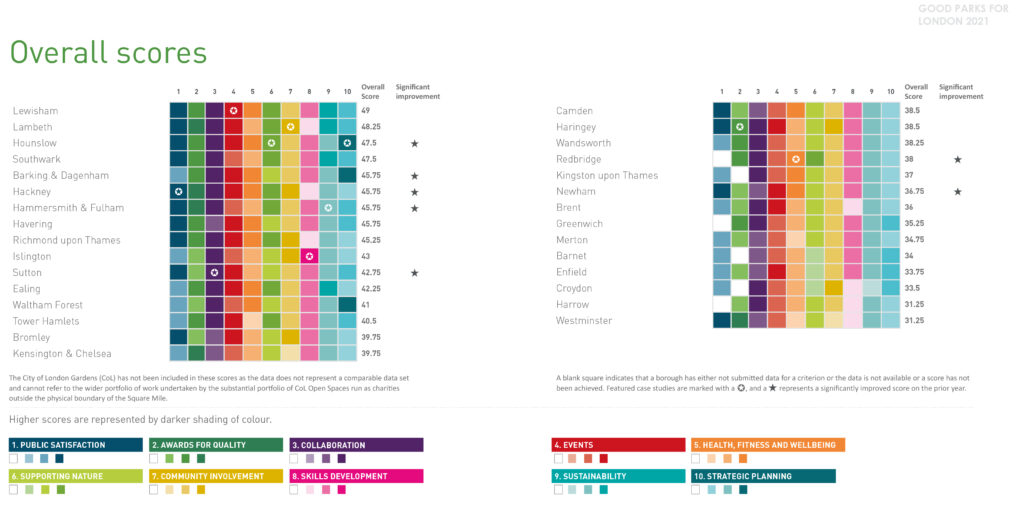
The table below shows the breakdown of how each participating London borough performed in each criteria, and the boroughs are listed in the order of their total scores across all ten criteria.
(Note that the number given under each criterion (1 to 3) is not the score the borough is given for that criterion. It reflects how well it scored in the area, with 1 indicating a low score, and 3 indicating a high score.)
Criteria:
- Public satisfaction
- Awards for quality
- Collaboration
- Events
- Health, fitness and wellbeing
- Supporting nature
- Community involvement
- Skills development
- Sustainability
- Strategic planning
| Criteria | 1 | 2 | 3 | 4 | 5 | 6 | 7 | 8 | 9 | 10 | Total score | |
| Lewisham | 3 | 2 | 3 | 3 | 3 | 3 | 2 | 2 | 3 | 2 | 49 | |
| Lambeth | 3 | 3 | 3 | 3 | 2 | 3 | 3 | 1 | 3 | 2 | 48.25 | |
| Hounslow | 3 | 2 | 3 | 3 | 3 | 3 | 2 | 2 | 2 | 3 | 47.5 | |
| Southwark | 3 | 2 | 3 | 2 | 2 | 3 | 2 | 2 | 3 | 2 | 47.5 | |
| Barking & Dagenham | 2 | 2 | 3 | 3 | 3 | 2 | 2 | 2 | 2 | 3 | 45.75 | |
| Hackney | 3 | 3 | 3 | 3 | 3 | 3 | 3 | 1 | 2 | 1 | 45.75 | |
| Hammersmith & Fulham | 3 | 3 | 3 | 2 | 2 | 3 | 2 | 2 | 2 | 2 | 45.75 | |
| Havering | 3 | 2 | 2 | 3 | 3 | 2 | 2 | 2 | 2 | 2 | 45.75 | |
| Richmond upon Thames | 3 | 2 | 3 | 3 | 3 | 3 | 3 | 1 | 2 | 1 | 45.25 | |
| Islington | 2 | 1 | 3 | 2 | 2 | 2 | 3 | 3 | 2 | 1 | 43 | |
| Sutton | 3 | 1 | 3 | 3 | 2 | 2 | 2 | 2 | 2 | 2 | 42.75 | |
| Ealing | 2 | 2 | 3 | 3 | 3 | 3 | 2 | 2 | 3 | 1 | 42.25 | |
| Waltham Forest | 2 | 1 | 2 | 2 | 3 | 2 | 2 | 2 | 2 | 3 | 41 | |
| Tower Hamlets | 2 | 2 | 3 | 3 | 1 | 3 | 2 | 2 | 2 | 2 | 40.5 | |
| Bromley | 3 | 1 | 2 | 3 | 2 | 2 | 3 | 2 | 2 | 1 | 39.75 | |
| Kensington & Chelsea | 2 | 3 | 2 | 2 | 2 | 2 | 1 | 2 | 2 | 1 | 39.75 | |
| Camden | 3 | 1 | 2 | 2 | 3 | 2 | 2 | 2 | 2 | 1 | 38.5 | |
| Haringey | 3 | 2 | 3 | 3 | 2 | 2 | 3 | 2 | 2 | 1 | 38.5 | |
| Wandsworth | 2 | 2 | 3 | 2 | 2 | 2 | 2 | 2 | 2 | 1 | 38.25 | |
| Redbridge | 0 | 2 | 3 | 2 | 3 | 3 | 2 | 2 | 2 | 1 | 38 | |
| Kingston | 2 | 0 | 3 | 2 | 3 | 2 | 2 | 2 | 2 | 1 | 37 | |
| Newham | 3 | 1 | 2 | 3 | 3 | 2 | 2 | 2 | 2 | 1 | 36.75 | |
| Brent | 2 | 1 | 3 | 3 | 2 | 2 | 2 | 1 | 2 | 1 | 36 | |
| Greenwich | 0 | 2 | 3 | 2 | 2 | 2 | 2 | 2 | 2 | 2 | 35.25 | |
| Merton | 2 | 1 | 2 | 2 | 1 | 2 | 2 | 2 | 2 | 1 | 34.75 | |
| Barnet | 2 | 0 | 2 | 2 | 2 | 1 | 2 | 2 | 2 | 2 | 34 | |
| Enfield | 2 | 1 | 2 | 3 | 2 | 1 | 2 | 2 | 2 | 2 | 33.75 | |
| Croydon | 2 | 0 | 3 | 2 | 2 | 1 | 3 | 1 | 1 | 2 | 33.5 | |
| Harrow | 0 | 1 | 3 | 2 | 2 | 2 | 2 | 1 | 2 | 1 | 31.25 | |
| Westminster | 3 | 3 | 2 | 2 | 1 | 2 | 1 | 1 | 2 | 1 | 31.25 |